Monitoring resource usage in a pool of micro-partitions
(using onTune SPA for micro-partition of IBM Power Virtualization)
Micro-partitioning is a very good facility to achieve the highest CPU resource utilization. When monitoring CPU pool resource usage, even good tools such as topas_nmon and lparstat exhibit problems and limitations. For example, we know of no tool today capable of displaying a CPU pool’s micro-partitions in one view as members of that CPU pool.
In general, IBM advises that if you keep the free cpu ratio in the pool to over 30%. In real-world usage, the PowerVM idle of the pool will usually drop below 30%, an indication that you’re utilizing more resources. This situation requires that the System administrator keep an eye on resource utilization of the CPU pool.
Now, wouldn’t it be great for the system administrator or engineer to have a tool that:
- show Processors Consumed (PC) of all micro-partitions in its own CPU pool in one chart view, with the cpu count of the cpu pool as the maximum limit (meaning the maximum value of the top axis of the chart). It would be even more useful if the tool can present the PC graph aggregated (or stacked) repeatedly. (For this chart then, the idle cpu of the pool is the white space between the top-most PC graph, and the maximum limit)
- allow monitoring interval to units in seconds. If the cpu usage of a few servers peak and recede within a few seconds, and with the monitoring interval limited at one minute, the average usage chart over one minute will be even. Yet, the possibility of cpu pool shortage for a number of seconds within that minute is high. This portends to a potential danger in the future, even though it may not be for the present. This knowledge forewarns the system engineer when planning to give careful consideration to adding extra micro-partitions to the cpu pool.
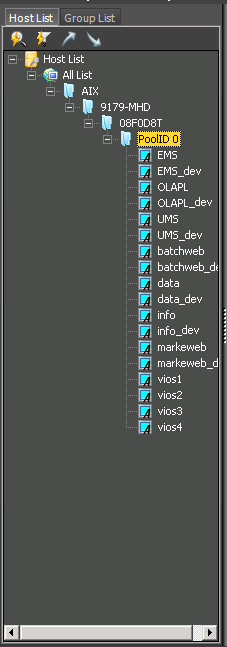
- make a group automatically consist of micro-partitions belonging to its own cpu pool with the same serial number and pool ID. This can help the System Administrator tremendously, as it’s quite common for the System Admin to be confused which micro-partition belongs to which cpu pool.
onTune SPA is a Server Performance and Analysis tool that provides the capabilities described above for monitoring resource usage in Micro-partition CPU pools. The graph below present the capabilities in one view.

The Title of the chart is CPUPool(64) of 9179-MHD-08F0D8T-0, and indicates the following:
cpu pool has 64 cores (CPUPool(64)) (the maximum value of top axis of the above chart is 64)
machine type : 9179; model : MHD; serial number : 08F0D8T; pool ID : 0 (9179-MHD-08F0D8T-0 )
The Monitoring interval is in seconds. (shown actual interval is 2 seconds, 10 minutes between time labels)
In addition, onTune SPA is able to discover the partition and pool information automatically, as shown in the dialogue panel below, and the above chart. No additional manual steps or operations are needed to obtain the above chart view.

The ability to monitor resource usage in a micro-partition CPU pool with the utility described above is only one of the many capabilities of onTune SPA.
Ontune SPA was developed by and for System Administrators and Engineers to give them the tools to monitor and analyze system performance in complex multi-server and virtualized environments. It is a comprehensive Server Performance and Analysis Tool available for AIX, HPUX, Solaris, and Linux (including Oracle Exadata)
Visit http://www.ontune.us for more information and to download free trial.
onTune SPA – the most capable System Performance Monitor an Analyzer for IBM virtualized server environments !
“onTune SPA has all the functionality we need, and none of the fancy stuff we don’t want…” Retail Customer
“I can’t understand how I did it before without onTune SPA…” Semiconductor Manufacturer Customer

