| Free-to-use lxtx program download |
| Download 30-day LxTxViewer Free Trial |
| LxTx Manual & Install Guide |
| View Videos |
At a Glance
Free-to-use lxtx program download (Supports x64 Linux Kernel 2.4 or later)
lxtx – Introduction
1. lxtx is,
A simple command line program, like vmstat, sar, or iostat.
lxtx is free-to-use, and may be downloaded at http://ontune.us
lxtx was developed to streamline an integrated monitoring of Linux servers.
lxtx replaces vmstat, sar, iostat, nmon, ps, lsof and other Linux monitoring programs, described below:
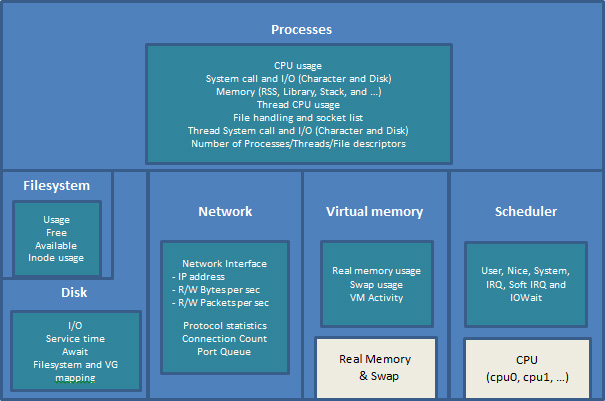
– Above features might cover the image below except trace or hardware level.
2. lxtx advantages
– Several commands or tools are usually needed to monitor performance items in Linux;
Using lxtx reduces the inconvenience, troubles, and errors that come with using several commands or tools, and their various options, because it covers the entire performance monitoring range.
– lxtx shows the differential file position when a process issues file I/O. This file position delta value can generally represent file I/O in the case of sequential read or write. The owner process information must of course be included with it.
– lxtx shows current active port queue length. A port can generally be considered as a path for an application service. Since network I/O happens via port queue, port queue activity can be used to monitor application activity. lxtx shows owner process information together with inode mapping throughout.
* High network I/O doesn’t mean high queue length, because speedy system can complete I/O requests before making a long queue. However, high queue length should be considered as a symptom of a big load in a network performance.
– lxtx shows protocol items’ activity via netstat delta, by which users may identify TCP/IP activities.
– lxtx shows mapping information of each disk for the case of Disk performance data. Via translation of multipath, pvs, and mount, lxtx shows the mounted filesystem, logical volume name, or volume group name, that each disk belongs to.
– lxtx shows filesystem’s usage delta, such as how much free size(or inode usage, etc) of each filesystem is increased/decreased.
* “Differential” is used the same as “Delta”; eg. Differential File Position = File Position Delta
3. How to run lxtx
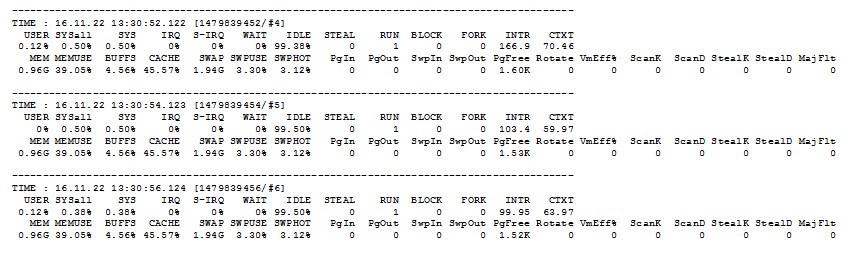
CPU & Memory Utilization(Basic performance items) : ./lxtx -b
Each process performance information : ./lxtx -p 24 (24 is the maximum process entry count to display.)
Differential file position : ./lxtx -p 24 -f
(-f shows entries with detected position change, and -F shows every file entry.)
Socket list : ./lxtx -p 24 -S (Every socket owned by each process is displayed.)
Newly created or terminated process : ./lxtx -p 24 -k
Network interface performance : ./lxtx -n 8 (8 is the maximum network interface entry count to display.)
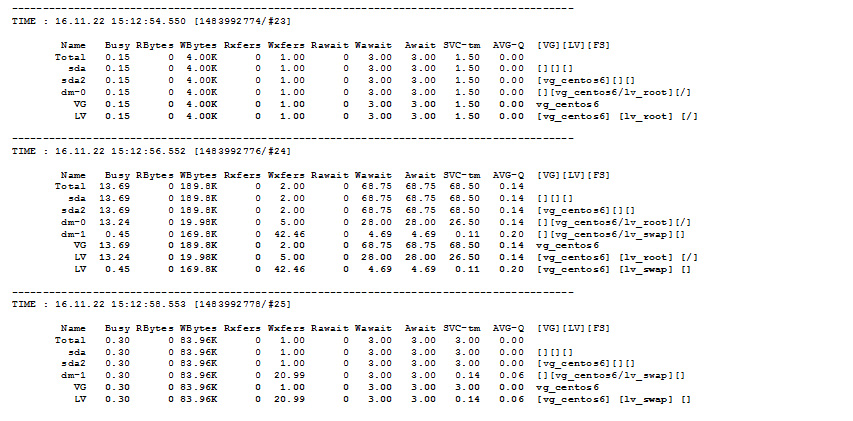
Disk performance : ./lxtx -v -d 16 (16 is the maximum disk entry count to display.) -v option shows LV / VG entries.
Port Queue Length : ./lxtx -o 8 (8 is the maximum port entry count to display.)
Differential Filesystem Status(Filesystem delta) : ./lxtx -m (shown when change is detected.)
Differential protocol statistics(netstat delta) : ./lxtx -t (shown when change is detected.)
Monitoring interval : -s 2 (2 second interval) Or -i 500 (500ms interval). 2 second interval is applied when interval is not defined.
Monitoring count : -c “Count”. Infinite count is applied when count is not defined.
./lxtx -a : -a option applys below:
à ./lxtx -b -p 24 -f -k -o 4 -n 4 -d 8
Basic items such as CPU/Memory, Each process(Differential File position and process creation/termination included), Port Queue, Network interface, and Disk monitoring are applied.
4. Resource usage comparison
* Command option for a test. [ Monitoring interval is 1 second ]
– nmon : nmon -f -t -s 1 -c 86400
– lxtx as nmon : ./lxtx -b -d 1000 -p 1000 -n 1000 -T 0 -s 1 -c 86400
– lxtx full option : ./lxtx -T 0 -b -p 1000 -d 1000 -n 1000 -o 1000 -f -m -t -s 1 -c 86400
* System specifications : All are guest linux servers with Intel i7 4 cores and 4GB Memory of VMware 12 pro.
| CentOS 5.8 | nmon 16f | lxtx (as nmon) | lxtx full option |
| CPU | 0.4% | 1.0% | 1.2% |
| Memory(RSS) | 1.0MB | 9.0MB | 12.3MB |
| CentOS 6.7 | nmon 16f | lxtx (as nmon) | lxtx full option |
| CPU | 1.0% | 1.4% | 3.1% |
| Memory(RSS) | 1.1MB | 12.7MB | 21.6MB |
| CentOS 7.1 | nmon 16f | lxtx (as nmon) | lxtx full option |
| CPU | 1.9% | 3.0% | 4.9% |
| Memory(RSS) | 1.3MB | 15.4MB | 24.7MB |
5. Functional comparison
| nmon 16f | lxtx 1.1.12 | Additional description | |
| CPU Utilization | User / Sys / Wait / Idle / Steal. Sys includes IRQ and Soft IRQ. | User / SYSall / Wait / Idle / Steal / SYS / IRQ / Soft IRQ. | SYSall is similar to Sys in nmon. lxtx breaks down SYSall to IRQ, Soft IRQ, and SYS separately. |
| Memory and Virtual Memory Activity | High/low memory status, as well as many individual VM items are collected. | Current status without high/low in memory data. VM items are narrowed from general perspective according to order of importance. Additionally, lxtx shows VM Efficiency. | VM Efficiency : Near 100% means stealing pages is achieved easily; while low efficiency means stealing pages is strenuous for memory demands. 0% means no additional memory demands beyond current usage. |
| Proc(or Kernel) | Runnable,Blocked,pswitch, syscall,read,write,fork, exec,sem,msg. Actually, syscall/read/write/exec/sem/msg are not collected despite the definition. | same modality as nmon. | No related information in /proc regarding syscall/read/write/exec/sem/msg. |
| Each Process | CPU%,Size,ResSet/Text/Data, SharedLibrary, Minor/MajorFault. | In addition to nmon’s modality, character I/O, Read/Write SysCall, Read/Write Bytes and process start time are added. | Lxtx shows VmSize, VmPin, VmRSS, VmData, VmStack, VmLib, and VmSwap, instead of nmon’s process memory items. |
| Differential File Position | lxtx shows the differential file position owned by each process. | Differential file position usually can represent how much sequential read or write happens in the file. | |
| Number of Processes and more | lxtx shows the number of processes, threads, sockets, pipes, files, and read/write system calls by current processes. | ||
| Number of Ports | lxtx shows the number of each port status. | ||
| Network Interface | Read/Write KBytes and transfers per second. | In addition to nmon’s modality, each network interface is shown with its IP address. | |
| Port Queue Length | Queue length of opened port is shown with owner process. | ||
| Differential Protocol Statistics | lxtx shows activities of protocol by showing extent increase of each protocol statistics. | ||
| Differential Filesystem Usage | lxtx shows differential filesystem usage, such as increased/decreased free size; available size; and total size, including i-node. | ||
| Disk | Read/Write KBytes and transfers per a second, busy, and Block size. -g option provides user define disk group. Inclusion with service time. | In addition to nmon’s modality except -g option, await, service time, and queue length are added. In place of block size excluded, logical volume name, filesystem or volume group, are displayed together. | Since lxtx can recognize multipath, a member disk can be mapped to logical volume, or volume group. |
6. Examples
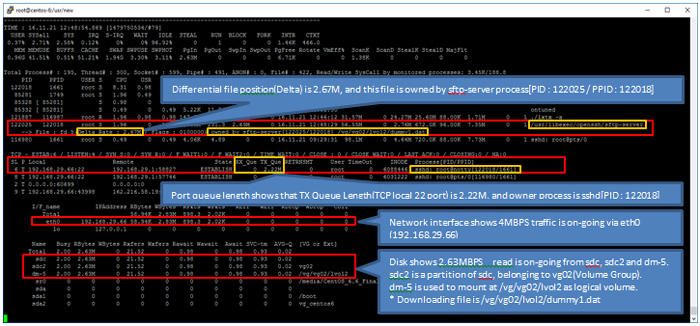
1) “./lxtx -a” Sample screen shot during downloading test via sftp
/vg/vg02/lvol2/dummy1.dat file is being downloaded via sftp.
sftp-server process is causing 2.67M file position delta,
and its parent process is causing 2.22M of TX queue length of local 22 port.
2.83MBPS writing(transmitting) is on-going via eth0. (IP is 192.168.29.66)
Disk read is on-going by 2.63MBPS at sdc, sdc2, and dm-5.
sdc is partitioned to sdc2, which is belonging to vg02 as volume group.
dm-5 is mapped to a logical volume to be used to mount at /vg/vg02/lvol2.
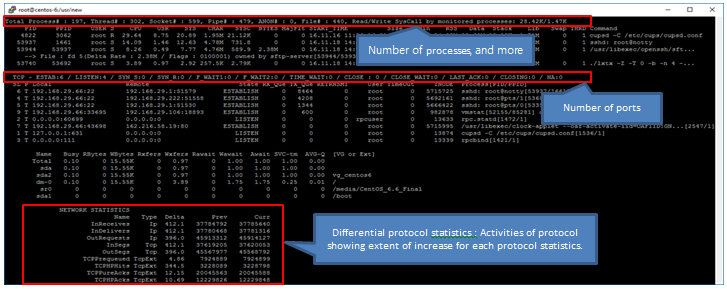
2) Process Count, Port Count, and Differential Protocol Statistics
3) Instead of vmstat: ./lxtx -b -s 2
* -b : Basic performance data
* -s 2 : 2 second interval (2 second interval applied if not defined.)
4) Instead of iostat: ./lxtx -v -d 4
* -d 4 : At most, top 4 disks are displayed
* -v : Disk data is followed by VG and LV data
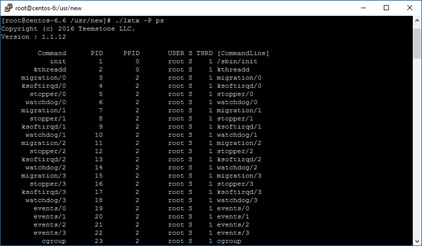
5) Process list replacing ps and lsof
lxtx can replace ps and lsof.
“./lxtx -P ps” shows a process list.
“./lxtx -P ps,time,mem -F -S” lists process entries with process start time and memory allocated.
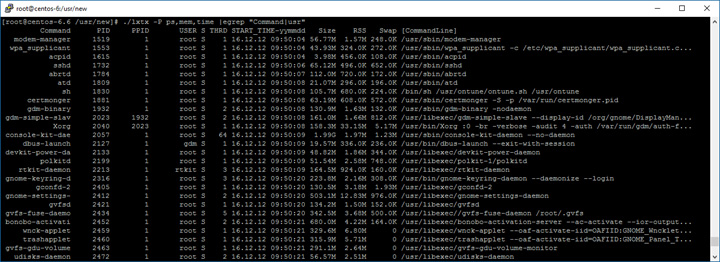
-F and -S are provided to check files and sockets opened by each process.
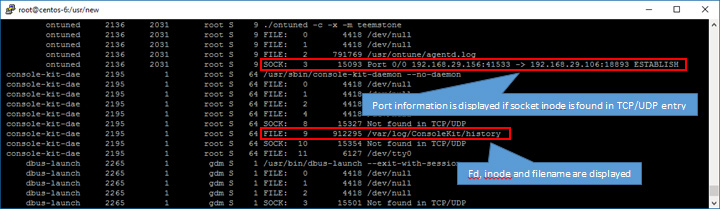
“-F” shows file fd, inode and filename opened by each process, and “-S” shows either socket inode or port information.
* Sample of “./lxtx -P ps -F -S”
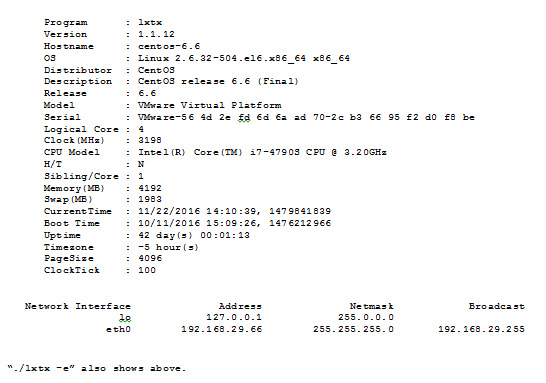
6) System Information
lxtx shows the system information when it starts.
- How to collect data
lxtx collects data from /proc files as below:
CPU/Memory : /proc/stat, /proc/meminfo
VM activity : /proc/vmstat
Process, Thread : /proc/[PID]/stat, /proc/[PID]/status, /proc/[PID]/io, /proc/[PID]/cmdline, /proc/[PID]/fd, /proc/[PID]/fdinfo, /proc/[PID]/task/[TID]/stat, /proc/[PID]/task[TID]/io
Network interface : /proc/net/dev
TCP/UDP port queue length : /proc/net/tcp, /proc/net/udp
Differential protocol statistics(netstat delta) : /proc/net/snmp, /proc/net/netstat
Disk : /proc/diskstats
Filesystem : /etc/mtab